This page is dedicated to posting screenshots of completed Learn ArcGIS tutorials and certificates
1. Getting Started with ArcGIS Pro
 |
| Figure 1: Getting Started with ArcGIS Pro Lesson 1 |
 |
| Figure 2: Getting Started with ArcGIS Pro Lesson 2 |
 |
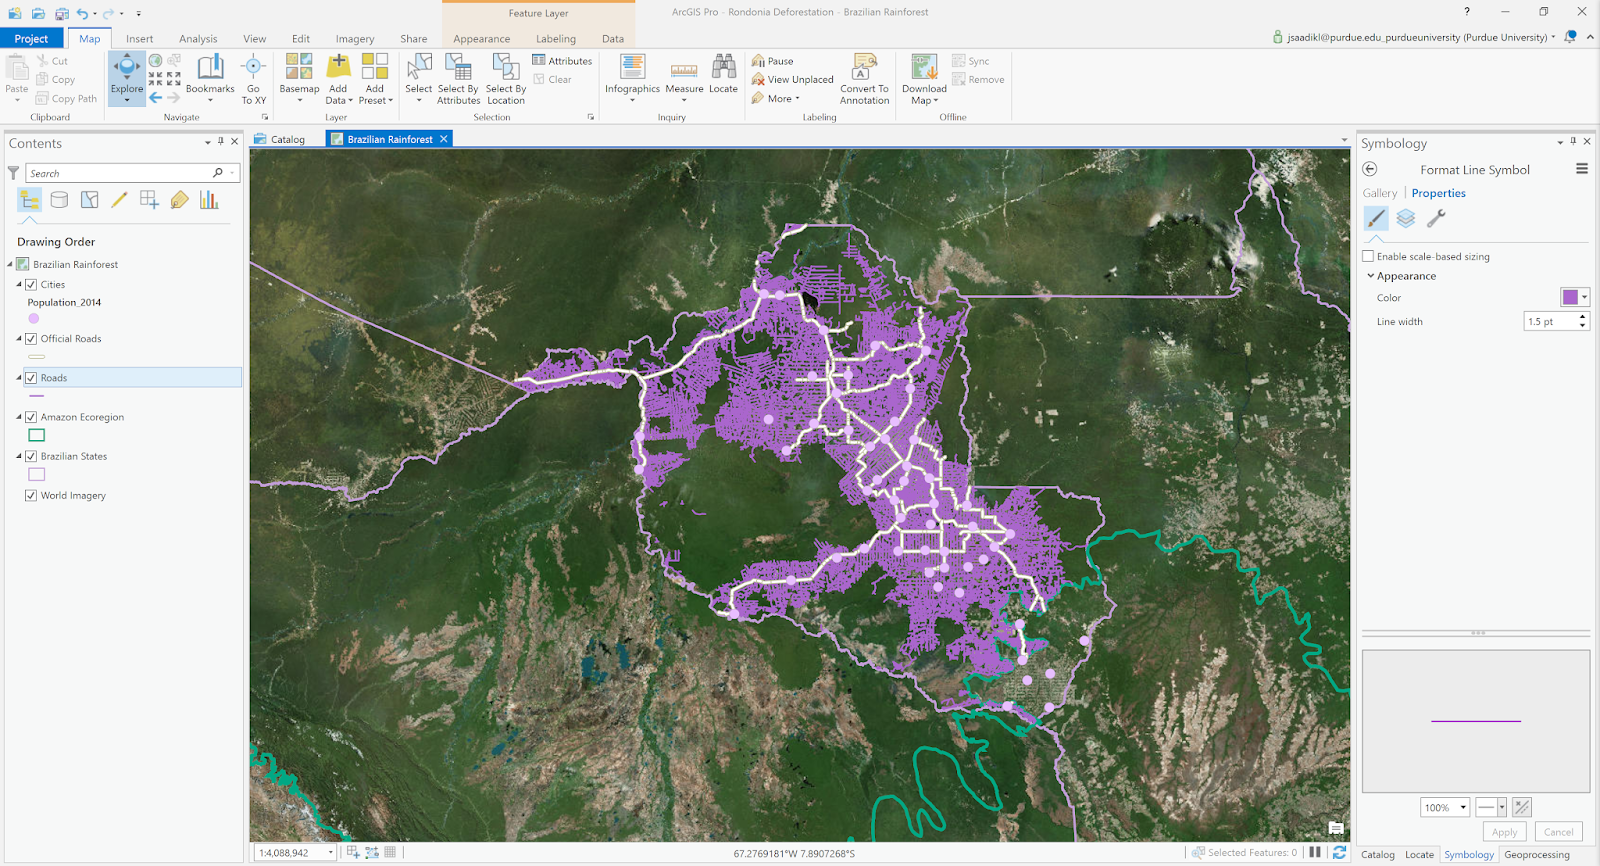
| Figure 3: Getting Started with ArcGIS Pro Lesson 3 |
 |
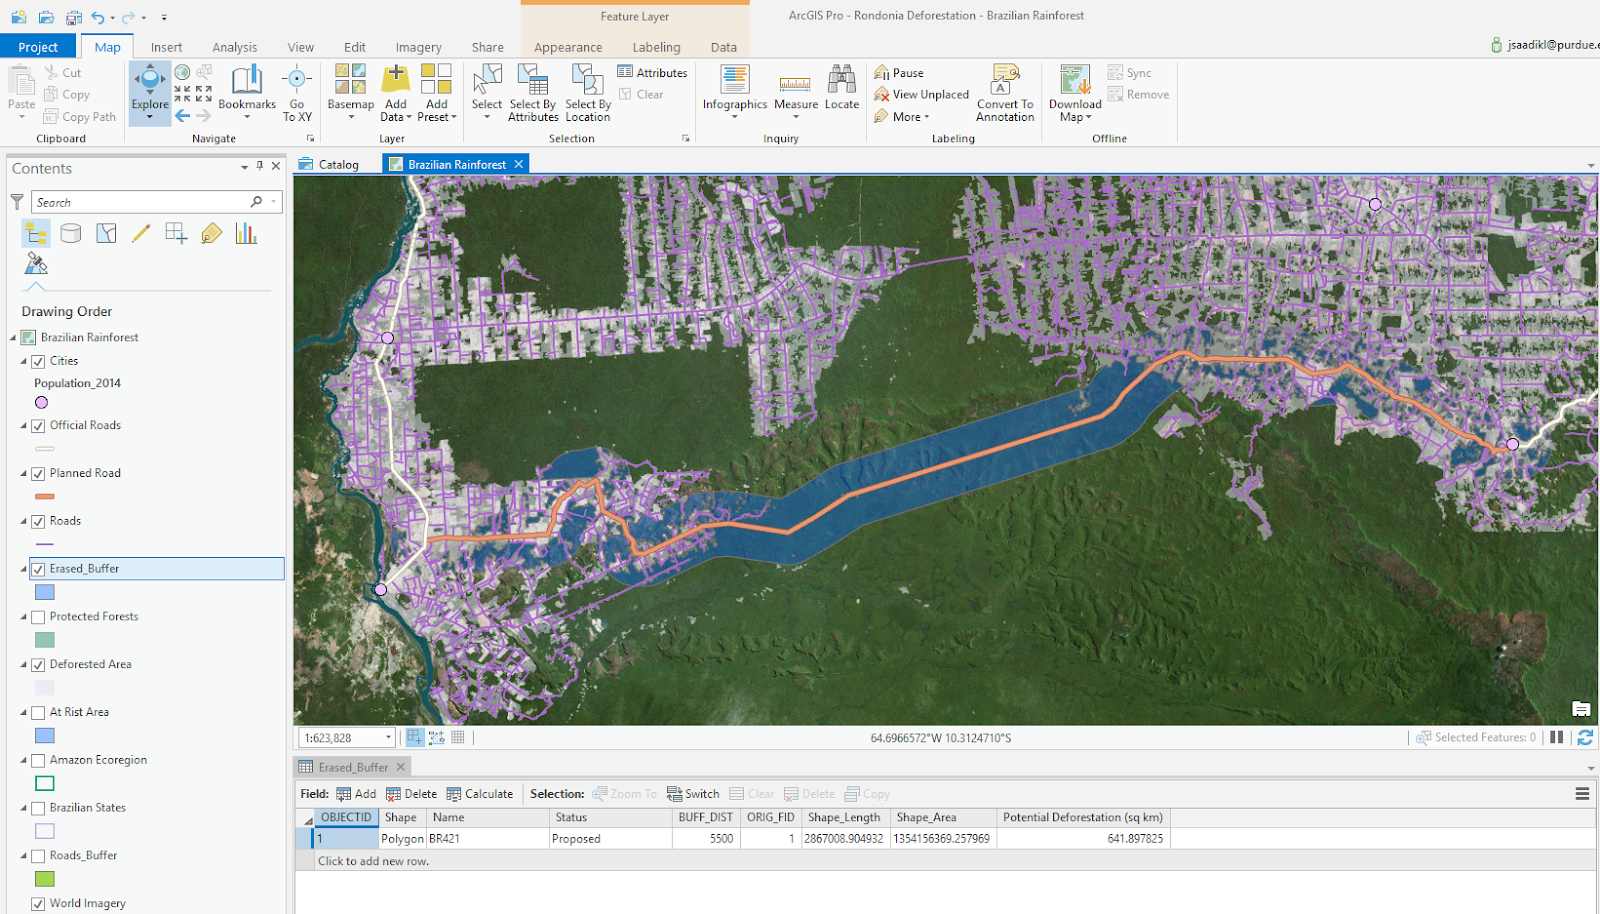
| Figure 4: Potential Deforested Area |
 |
| Figure 5: Getting Started with ArcGIS Pro Lesson 4 Final Map |
2. Extracting Roof Forms for Municipal Development Using LiDAR Data
 |
| Figure 22: Portland DSM |
 |
| Figure 23: Filtered LiDAR Data Points of The Ground Surface |
 |
| Figure 24: Portland DTM Created from the Ground Surface LiDAR Data |
 |
| Figure 25: Portland Normalized DSM (nDSM) |
 |
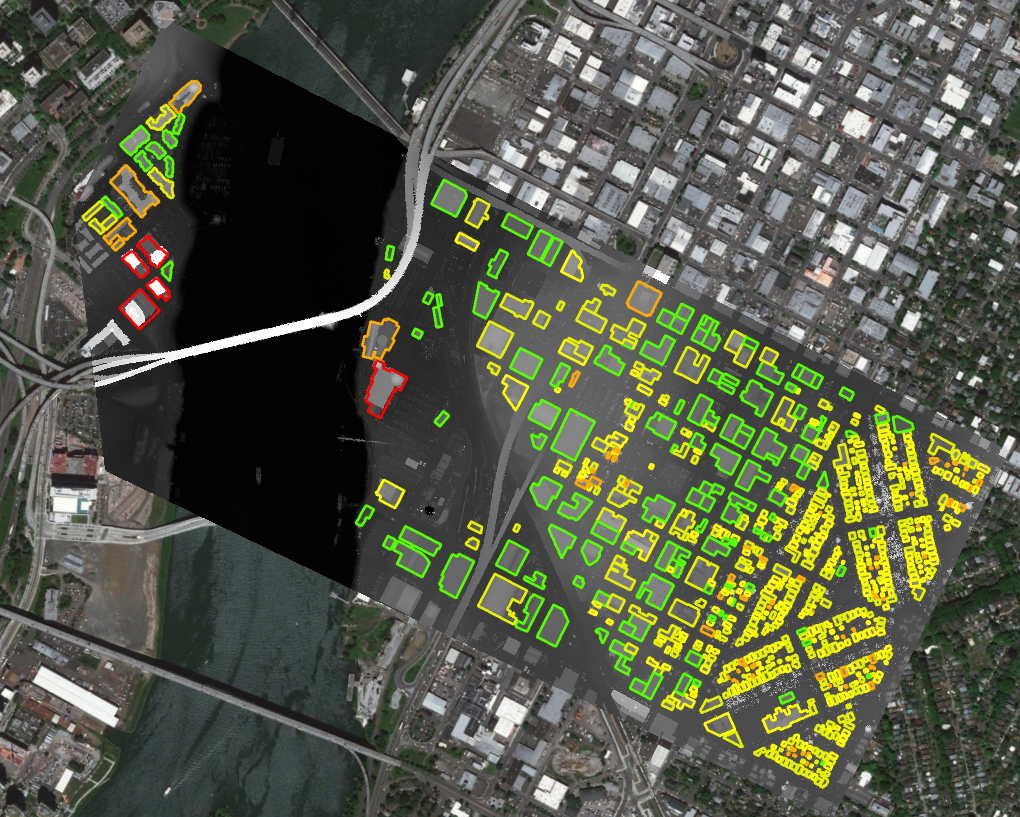
| Figure 26: Portland Roof Forms |
 |
| Figure 27: Using Roof Forms to Create 3D Representations of the Buildings |
 |
| Figure 28: Building Root Mean Square Error |
 |
| Figure 29: Building Root Mean Square Error Zoomed In |
 |
| Figure 30: Fixing Errors in Building Shape Part 1 |
 |
| Figure 31: Fixing Errors in Building Shape Part 2 |
3. Performing Viewshed Analysis in ArcGIS Pro
 |
| Figure 32: Amount of Illumination Over A Certain Area |
 |
| Figure 33: Areas Covered by Multiple Lights |
 |
| Figure 34: Viewshed Analysis in ArcGIS Pro Certificate |
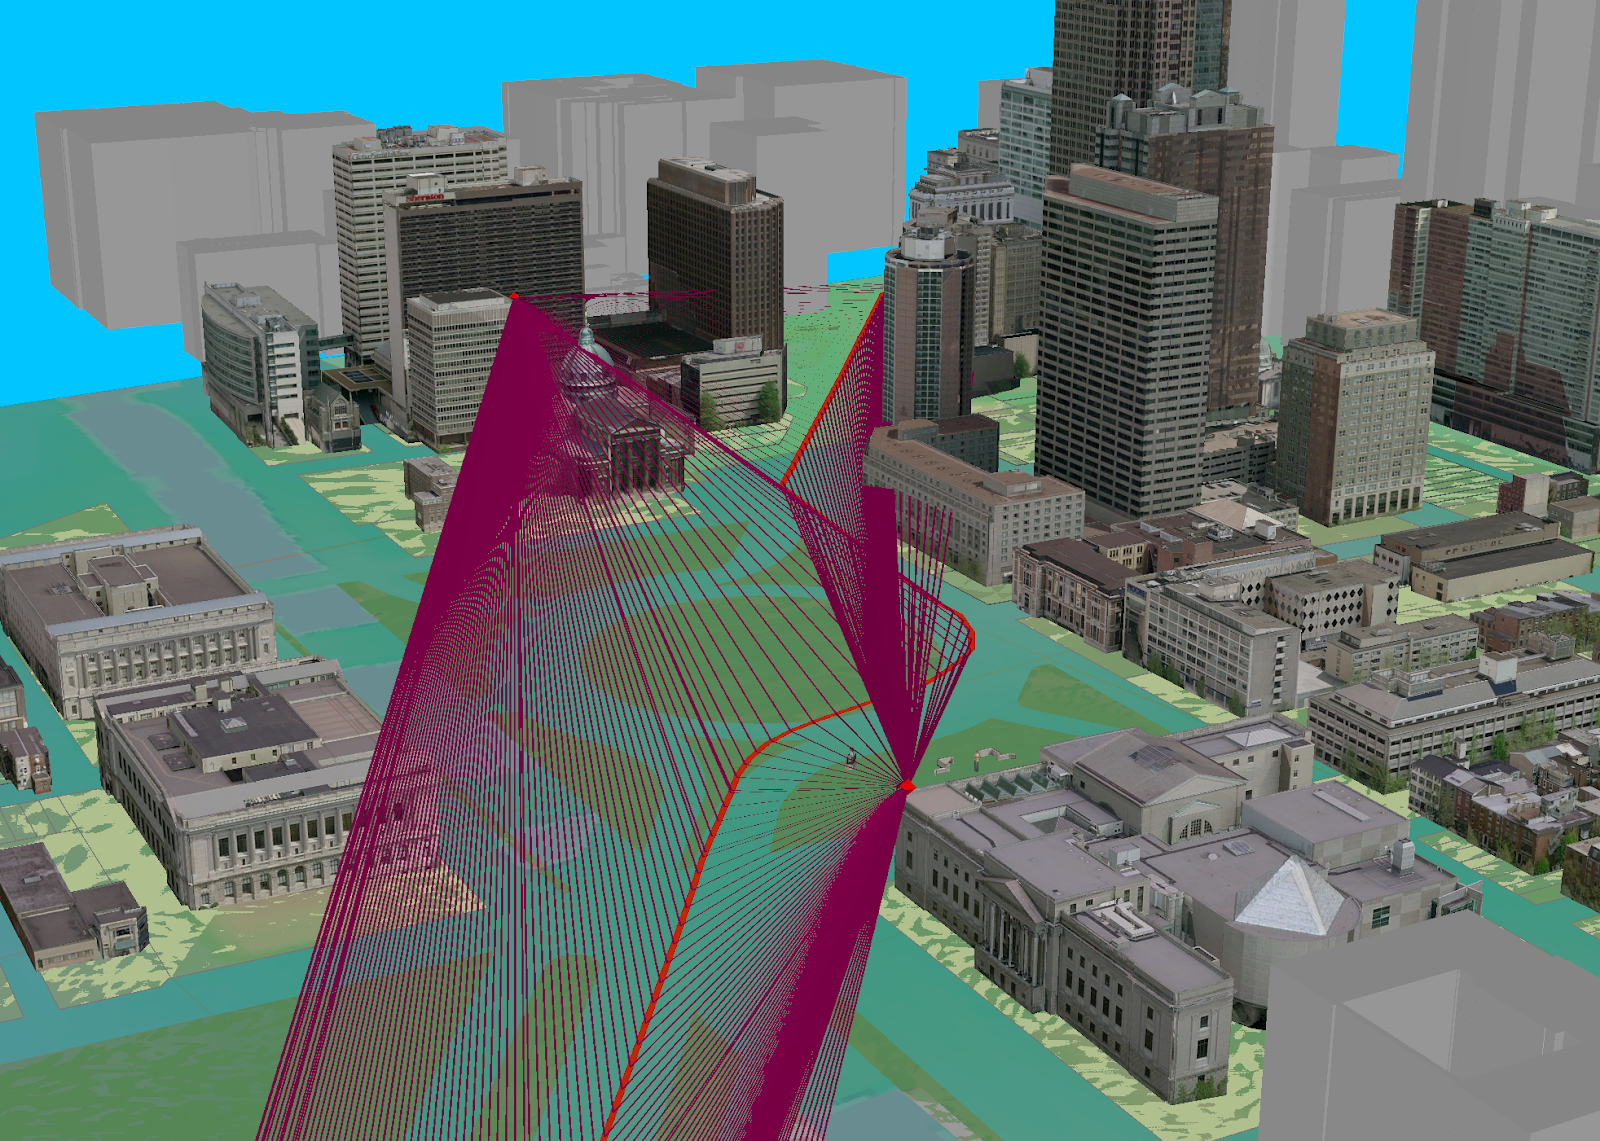 |
| Figure 35: Lines of Sight without Factoring in Obstacles |
 |
| Figure 36: Lines of Sight Factoring in Obstacles |
 |
| Figure 37: Visual Task Process Map |
 |
| Figure 38: Line of Sight Analysis Certificate |
5. Getting Started with Imagery (Intro to Satellite Data)
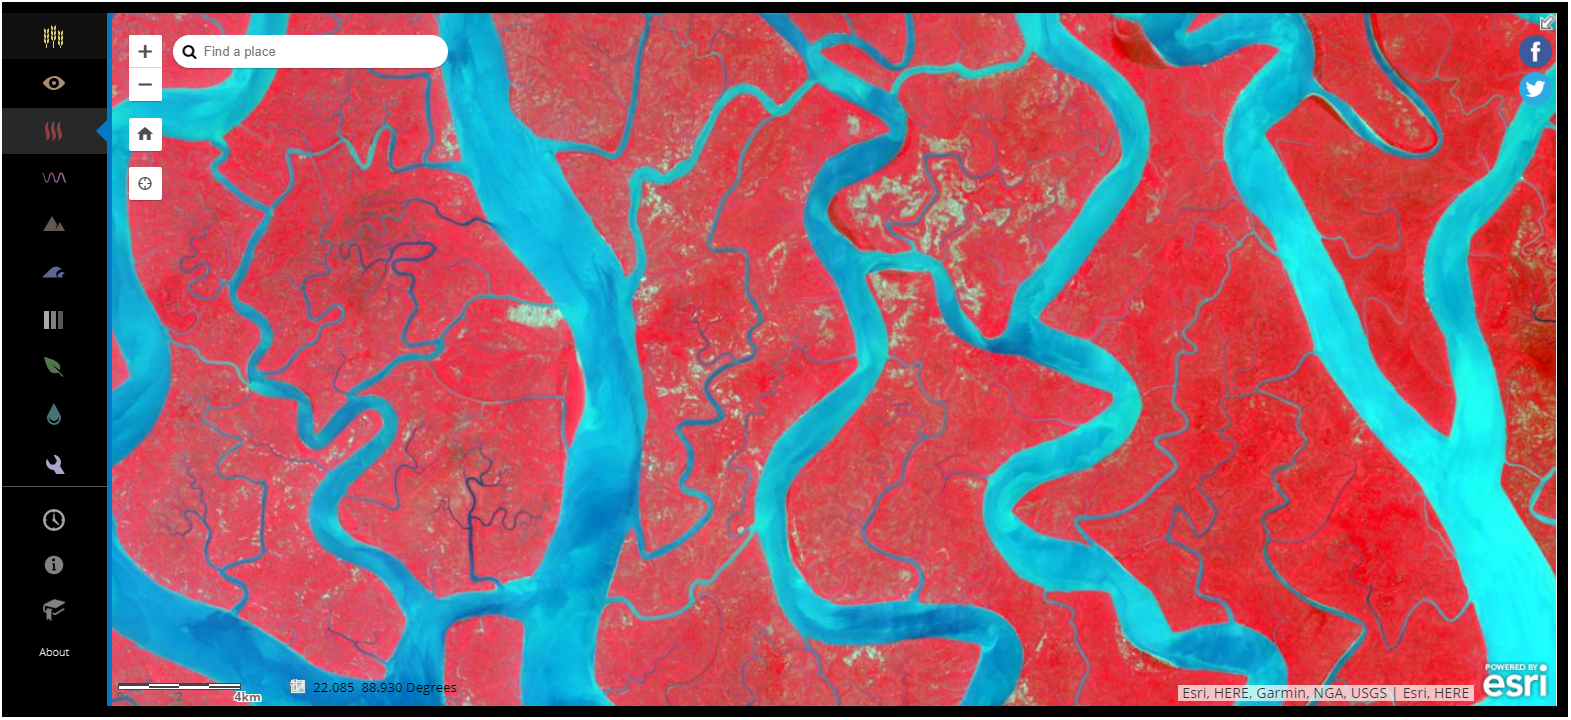 |
| Figure 6: Using ESRI's Landsat Imagery to View the Sundarbans Mangroves On the Border of India and Bangladesh |
 |
| Figure 7: Build Your Own Band Combinations |
 |
| Figure 8: Build Your Own Band Combinations |
 |
| Figure 9: Moisture Index |
 |
| Figure 10: Moisture Index Zoomed In |
 |
| Figure 11: Agriculture in the Dessert Near High Moisture Area |
 |
| Figure 12: Maldive Islands |
 |
| Figure 13: Bathymetric Band Combination Used to Better Show Under Water Features |
 |
| Figure 14: Suez Canal Construction Over Time Shown Here with 1 Channel |
 | |
|
6. Get Started with ArcGIS Earth
 |
| Figure 16: Using the Locator Tool To Find Paris |
 |
| Figure 17: Using the Locator Tool To Find Mount. St. Helens |
 |
| Figure 18: Using the Locator Tool To Find Auckland, Cairo, Mount Everest and, the Yucatan |
 |
| Figure 19: Adding In Data on The Number of Jobs Per Square Mile in San Francisco |
 |
| Figure 20: Adding In Data on the Oklahoma Ada-Vamoosa Aquifer |
 |
| Figure 21: Adding Live Traffic From Los Angeles |