GIS day Abstract and Updated Poster Draft
Introduction:
This past week Sam and myself have been working on creating an abstract for our poster that we will be presenting on GIS day on November 7th. Additionally, we completely reformatted our poster to attempt to make it more easy to understand.
GIS Day Abstract:
As mentioned above, we needed to create an abstract both to be able to sign up to present our poster at GIS day and for inclusion in our poster. The Goal of our abstract was to describe our project and what it was about in under 250 words. This led to a lot of editing and cutting of unnecessary words and repetitive language. The current version of the abstract is shown below:
With the increased use of Unmanned Aerial Systems (UAS) in the civilian market comes increasing concerns regarding the possibility of encounters between UAS and manned aviation. Amidst these concerns, the Federal Aviation Administration began a database of reported UAS sightings. A reported sighting is defined as a report made by a pilot to Air Traffic Control following a possible UAS encounter. This project focuses on using GIS tools to compare reported sightings, UAS pilots, and registered UAS databases, to explore spatial distributions and correlations between the databases. During the project, multiple maps were created to spatially compare the data and clarify the data sets on a national level. The content of maps created include: 1) the number of UAS pilot per state, 2) the number of reported sightings per state, 3) the clustering of UAS pilots compared to the distribution of the United States population, 4) the relative amount of reported sightings by city, 5) the clustering of UAS pilots compared to the clustering of non-hobbyist registered UAS by city, and 6) the number of reported sightings compared to the clustering of non-hobbyist registered UAS by city. In addition, the change in the number of registered pilots and reported sightings since the introduction of the Part 107 Certificate was also statistically displayed. The spatial outputs generated during the project show that many factors may play a role where reported sightings occur.
Updated Poster Draft:
Below in figure 1 you will find our original poster draft which was uninteresting in its standard left to right layout. In figure 2, we created a very rough mockup of an alternate poster design including the figures that will be included in the final poster as well as a rough mockup of the text that will be included. Please note that the graphical elements of the textboxes and title will change in the final version of the poster. With a bit of tweaking, we think that this format will be much better for our theme and will better attract people’s attention at GIS day.
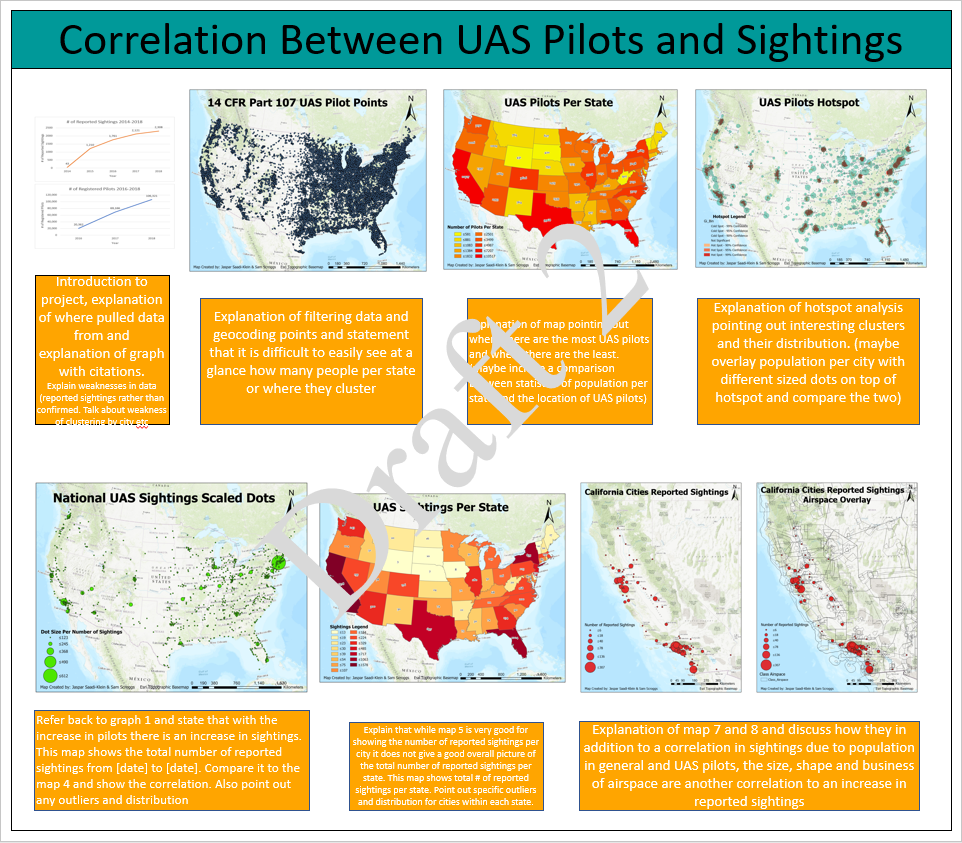 |
| Figure 1: Original Poster Draft |
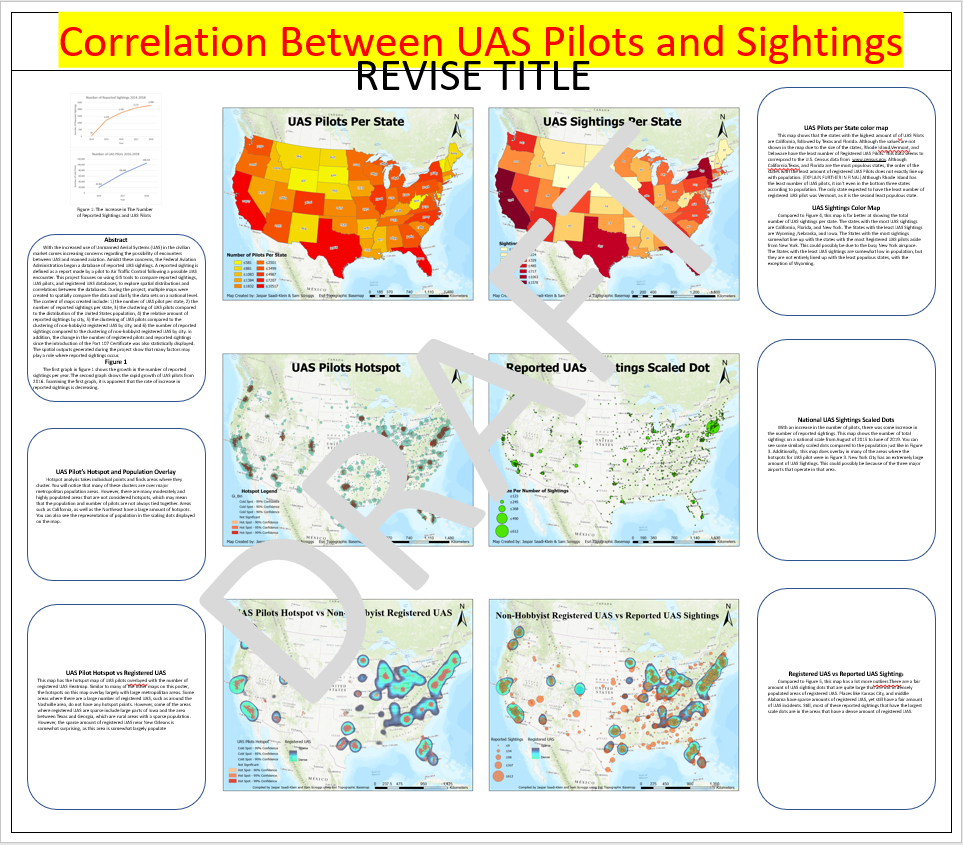 |
| Figure 2: Revised Poster Draft |
Instead of going back and editing our original story map, we decided to create an additional ArcGIS Swipe map that compares an individual UAS pilot points map to a UAS pilot hotspot analysis map with a population overlay. We decided to do this for two reasons. The first reason was because the details of the data in the maps shown in the poster and original post were difficult to see when zoomed out to a national level. The second reason we decided to create a separate swipe was because when we attempted to upload the new maps we generated as well as the data for the swipe map, errors kept popping up that completely messed up original story map. Our additional swipe and original is linked below.
New Swipe Map:
https://purdueuniversity.maps.arcgis.com/apps/StorytellingSwipe/index.html?appid=3c3ddc96fba341e7863004863d494546
Original Story Map:
https://storymaps.arcgis.com/stories/29a07b41d88b43c28513eaf149369523