AT40900 Capstone Project: Digging Deeper
Introduction:Our project deals with a lot of data, the initial challenges will be to join tables of disparate information and filter them so that we may begin to see patterns that we can investigate further. There are two main ways to merge and filter the data: Microsoft Excel and ArcGIS Pro. There are advantages and disadvantages to using each program and our group will be using a hybrid of both programs. Below is table 1 showing some of the advantages and disadvantages to using Excel versus ArcGIS Pro for merging and filtering.
 |
| Table 1: Advantages & Disadvantages of ArcGIS Pro Versus Excel when merging and filtering |
Problems and Certain Solutions:
There are many challenges to be overcome in order to analyze the data. These challenges along with certain solutions are listed below
Problem 1: Sam is working with the UAS Incidents database and has to reorganize the data, as the time/date, state,city, summary format does not stay consistently in the same cells. Additionally, U.S. territories and commonwealths are noted in these reports, so it will create a margin of error.Some Canadian UAS sightings are noted as well, which will need to be sorted through to determine if they should be mapped or not. He also needs to find out the number of incidents reported by state.
Solution 1: To reorganize the master document containing all UAS reports, Sam will have to manually cut and paste the information into the correct columns, and then re enter any deleted data from the original source documents. Using the find and replace tool, Sam will sort through all territories and commonwealth areas and remove them, as the group wants to focus only on the 50 states and the District of Columbia. Figure 1 below shows the find and replace tool being used.
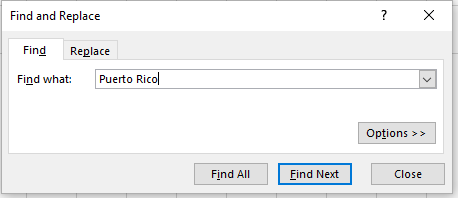 |
| Figure 1: Find and Replace Tool |
The process is as simple as hitting control+f and putting in the territory, and then hitting find next to find each term and manually deleting the selected row (see figure 2)
 |
| Figure 2: Manual Deletion of Incidents Outside of the Continental United States |
This same tool will be used to find all instances of Canada in the state column. Sam will look a each instance to determine if it occured in U.S. airspace or was mislabeled. If mislabeled, the instance will be deleted. To find the number of instances of an incident in each state, Sam will use the count IF function in excel (see figure 3).
 |
| Figure 3: Count IF function in Excel |
For example, this is his input for California. As the State row is the entire B column B:B is the input for range, and as we are looking for California, it is our criteria. The output will be the number of times excel finds our criteria in that range: 1676 in this case.
Problem 2: Jaspar is working with the Airmen Certification Database which is separated into two separate datasets. The first, Pilot_Basic, includes a unique ID, name, address and medical class information while the second, Pilot_Cert, includes a unique ID, name, type, level, and rating.
Solution 2: In order to merge the two datasets they were both converted into tables using the From Table/Range tool
 |
| Figure 4: Merging Pilot_Basic with Pilot_Cert |
 |
| Figure 5: Merge Tool Selections |
The problem with using excel to merge the datasets was that it was very difficult to implement and would often glitch extending the process time significantly.
Alternate Solution 2: An alternate, more easily implemented solution tried is to merge the two datasets directly in ArcGIS Pro. This has the advantage of being able to both merge the datasets and geocode the data so that each point will be represented on the map. In order to merge the datasets, the data must first be geocoded.
The process of geocoding is relatively simple when using the wizard. First, import the table, in our case, Pilot_ Basic. Next, right click on the table and click Geocode Table then follow the steps of the wizard (See figure 6).
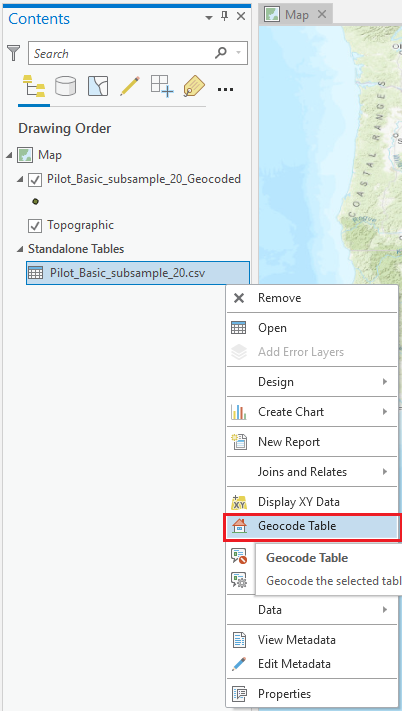 |
| Figure 6: How to Locate Geocode Table |
 |
| Figure 7: Table Join of Pilot_Basic and Pilot_Cert Geocoded |
Problem 3: We were not sure how to perform table joins in ArcPro to associate our data with a shapefile so that we can show symbology.
Solution 3: Using help from Zach Miller, a graduate student and the ArcGIS help page linked here, we found out how merge tables.
Here is an example of how to do a table join using our UAS Incident table and the shapefile for the continental U.S. states. We first need to right click on our shape file and click joins and relates and then add join (see figure 8).
 |
| Figure 8: Locating Table Join in ArcPro |
In the add join tab, we have our main table, the state shape file, and the table that we are joining to it, the UAS sightings file (see figure 9 below).
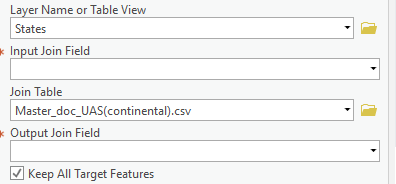 |
| Figure 9: Table Join Settings |
The common join field that we are going to use to combine these tables is the state name. This allows us to add the number of UAS incidents per state to the states shape file. Figure 10 below shows the Output Join Fields for our example being filled in.
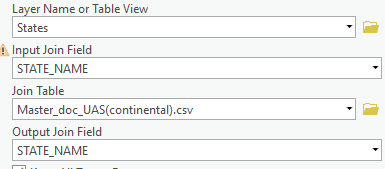 |
| Figure 10: Output Join Fields Set |
After clicking the run button at the bottom right hand corner of the “add join” box, you should see that the tables have been successfully joined (see figure 11).
 |
| Figure 11: Successful Table Join |
Problem 4: We need to figure out how to filter the datasets, especially with the Airmen Certification Database, so that it is easier to find details. Currently, the joined Pilot_Basic and Pilot_Cert is over 130 columns wide and needs to be slimmed down.
Solution 4: Open the table, highlight the column to be deleted, right click and click delete.
Problem 5: we don’t know how to find hotspots in our data so that we can find where there are high concentrations of UAS sightings and UAS pilots.
Solution 5: We found a link discussing how to perform hotspot analysis and applied it in an example shown below.
The first step is to pull up the hotspot analysis by going to the “tools” bar and searching for it. For our input feature class,we will use our states shapefile, which will automatically display the output feature class as well (see figure 12).
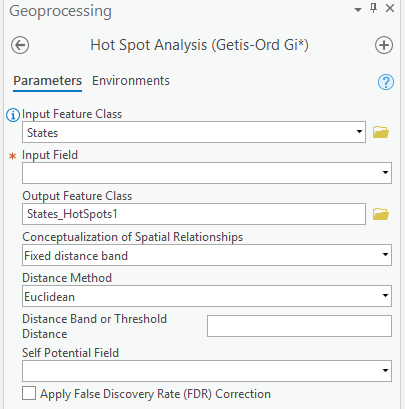 |
| Figure 12: Hot Spot Analysis Tool |
We then put in our # of UAS sightings as our input field and click run. Although there is some more sorting out to be done within the UAS sightings set itself, this map displays states with a large number of UAS incidents (see figure 13).
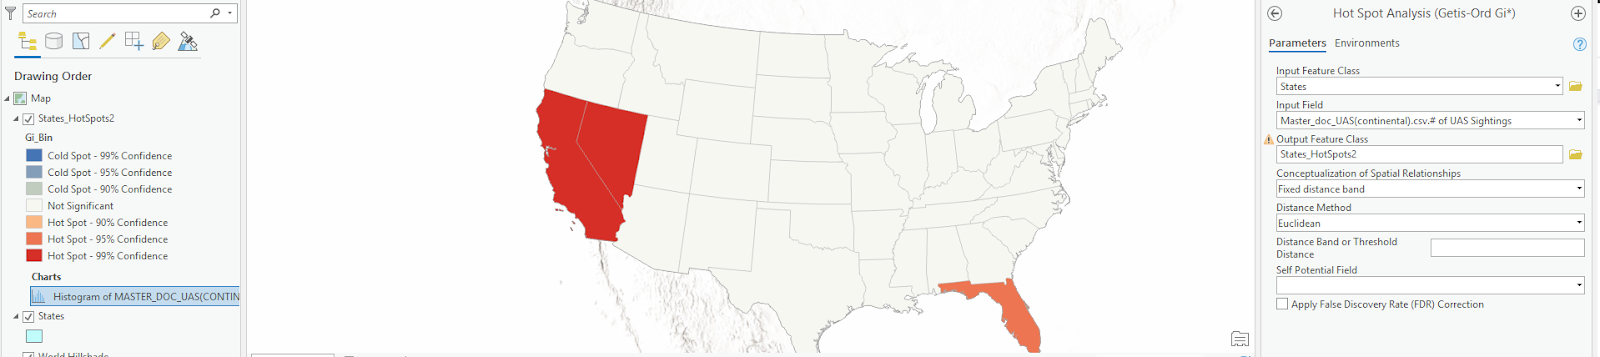 |
| Figure 13: Hotspot Analysis Output |
Allocations:
- Sam did the reorganization of data in excel, how to perform table joins in ArcPro, as well as how to perform hotspot analysis.
- Jaspar worked on the intro, how to merge data sets in excel and ArcPro, as well as filtering datasets.